
Welcome to our comprehensive comparative analysis, where we examine two noteworthy entities operating in the esteemed financial sector: NABIL and NICA. With a focus on providing an extensive evaluation of their financial performance, industry standing, management prowess, valuation metrics, and overall market outlook, we aim to provide you with valuable insights. By delving into these critical areas and dissecting the intricacies of each company, we endeavour to equip you with the necessary knowledge and understanding to make informed investment decisions in today’s dynamic marketplace.
1. Company Overview
NABIL Bank:
NABIL Bank Limited, one of the leading commercial banks in Nepal, has established itself as a trusted financial institution since its inception in 1984. The bank offers comprehensive banking services, including corporate and retail banking, trade finance, remittance, treasury operations, and digital banking solutions. With many branches and ATMs nationwide, NABIL Bank has played a pivotal role in facilitating financial transactions and promoting economic growth in Nepal. Known for its strong commitment to customer satisfaction, innovation, and efficient service delivery, NABIL Bank has earned a significant market share and built enduring relationships with individuals, businesses, and government entities alike.
NIC Asia Bank:
NIC Asia Bank Limited, another prominent commercial bank in Nepal, has steadily grown to become one of the key players in the country’s banking sector since its establishment in 1998. The bank offers various banking products and services, encompassing retail and corporate banking, trade finance, remittance, treasury operations, and digital banking solutions. NIC Asia Bank has established an extensive branch and ATM network throughout Nepal, providing convenient access to its customer base. With a customer focus and technology-driven solutions, the bank has garnered a reputation for its efficiency, reliability, and superior customer service. NIC Asia Bank contributes to Nepal’s financial landscape by supporting economic activities and fostering financial inclusion.
These overviews provide a glimpse into the operations, market presence, and customer focus of both NABIL Bank and NIC Asia Bank in Nepal. Further analysis will delve into their financial performance, industry standing, management strategies, and other factors to facilitate a more comprehensive comparative study between the two banks.
2. Financial Performance
Introducing the financial performance of NABIL Bank and NIC Asia Bank based on their third-quarter reports, we delve into the latest available data to provide insights into the revenue growth, profitability and asset quality of these prominent banks operating in Nepal.
i) Total Assets
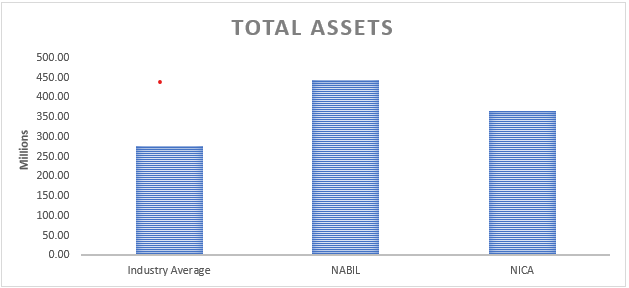
Total assets refer to the combined value of all assets owned or controlled by a company, including cash, investments, loans, buildings, and other tangible and intangible assets.
The analysis of total assets provides valuable insights into the scale and scope of operations for NABIL Bank and NIC Asia Bank relative to the industry average.
Firstly, NABIL Bank’s total assets of Rs 443,225,516.00 significantly exceed the industry average of Rs. 278,312,436.69. This data indicates that NABIL Bank boasts a more extensive asset base, reflecting its substantial presence and market share within the banking industry.
Similarly, NIC Asia Bank’s total assets of Rs. 364,776,364.59 surpass the industry average. Although slightly lower than NABIL Bank’s total assets, it still signifies that NIC Asia Bank possesses a substantial asset base and has established itself as a significant player in the industry. The higher total assets of NIC Asia Bank may be attributed to factors such as a well-diversified asset portfolio, a solid customer base, and strategic investments.
Having more significant total assets compared to the industry average indicates that both NABIL Bank and NIC Asia Bank have the potential to leverage their scale and resources to support their operations, provide a wide range of services, and capture market growth opportunities. It also signifies their ability to attract and manage deposits effectively, deploy funds in various investment avenues, and extend credit to meet the financing needs of individuals and businesses.
ii) Net Interest Income
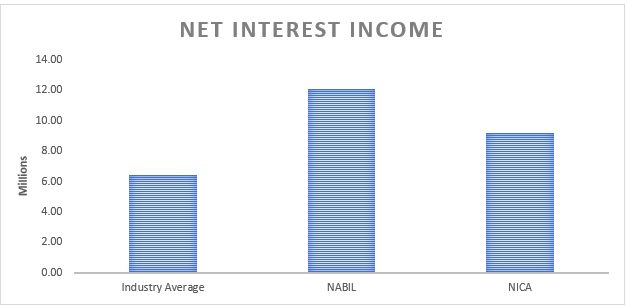
Net interest income refers to the revenue a financial institution generates from the interest earned on its interest-earning assets minus the interest paid on its interest-bearing liabilities (such as deposits and borrowings). It is a crucial indicator of a bank’s core profitability and reflects the effectiveness of its interest rate spread and interest rate risk management.
Based on the provided data, the analysis of net interest income reveals exciting insights into the financial performance of NABIL Bank and NIC Asia Bank.
First, the net interest income of NABIL Bank, which stands at Rs. 12,101,158.00, is substantially higher than the industry average of Rs. 6,416,000.69. This data indicates that NABIL Bank has effectively leveraged its interest-earning assets to generate a significant amount of interest income. The bank’s loan portfolio and investment strategies have successfully generated substantial returns.
Similarly, NIC Asia Bank’s net interest income of Rs. 9,217,033.65 surpasses the industry average. While slightly lower than NABIL Bank’s net interest income, it still indicates that NIC Asia Bank has achieved strong interest income generation relative to its interest-bearing liabilities. This data suggests effective management of interest rate spread and a well-performing asset portfolio.
Both banks’ net interest income figures exceeding the industry average are positive indicators of their profitability and ability to generate substantial income from their core operations. It implies that they have optimized their interest rate differentials and effectively managed their interest-bearing liabilities.
iii) Net Income
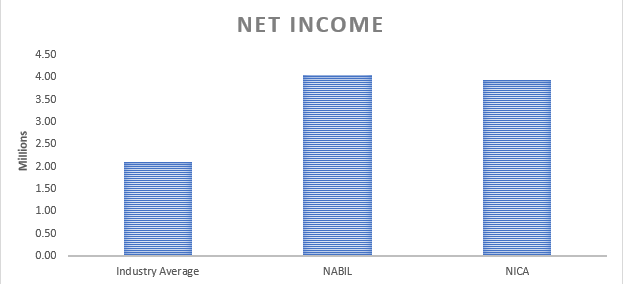
Net income represents a company’s profit after deducting all expenses, taxes, and interest from its total revenue. The net income analysis provides valuable insights into the profitability of NABIL Bank and NIC Asia Bank compared to the industry average.
Firstly, NABIL Bank’s net income of Rs. 4,047,426.00 significantly surpasses the industry average of Rs. 2,105,597.65. This data indicates that NABIL Bank has achieved a higher level of profitability relative to its industry peers. The substantial net income suggests that NABIL Bank has effectively managed its expenses, interest costs, and provisions, resulting in a healthier bottom line. This data signifies the bank’s ability to generate solid earnings and positively reflects its operational efficiency and financial performance.
Similarly, NIC Asia Bank’s net income of Rs. 3,937,385.25 also exceeds the industry average, albeit slightly lower than NABIL Bank. This data indicates that NIC Asia Bank has successfully generated satisfactory profitability. It implies that the bank has effectively controlled its costs, managed its operations efficiently, and implemented sound risk management practices, resulting in positive earnings.
In comparison to the industry average, the higher net income figures for both NABIL Bank and NIC Asia Bank underscore their ability to generate profits above the benchmark. This data demonstrates their strength in revenue generation, effective cost management, and risk mitigation strategies. It reflects positively on their overall financial health and indicates higher economic performance and stability.
iv) Earning per Share (EPS)
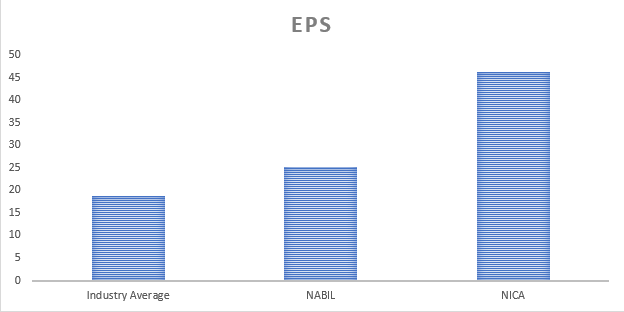
Earnings Per Share (EPS) is a financial metric that indicates a company’s profitability on a per-share basis. Earnings per Share is calculated by dividing net income by the average number of outstanding shares during a specific period. The Earnings Per Share (EPS) analysis sheds light on the profitability of NABIL Bank and NIC Asia Bank compared to the industry average.
Firstly, NABIL Bank’s EPS of Rs. 25.21 surpasses the industry average of Rs. 18.71. This data indicates that NABIL Bank has generated higher earnings per share than the industry average. The bank has effectively translated its net income into earnings for each outstanding share, a positive indicator of its profitability and ability to generate shareholder returns. A higher EPS implies that NABIL Bank has successfully created value for its shareholders through its operations.
On the other hand, NIC Asia Bank’s EPS of Rs. 46.29 significantly exceeds the industry average and NABIL Bank’s EPS. This data indicates that NIC Asia Bank has achieved exceptional profitability, generating substantial earnings per share. The higher EPS suggests that NIC Asia Bank has efficiently converted its net income into profits for each outstanding share, showcasing its strong profitability and potential for generating shareholder value.
V) Non-performing Loan to Total Loan
The non-performing loan to total loan ratio is a financial metric that measures the proportion of non-performing loans (NPLs) to the total loan portfolio of a bank. It provides insights into a bank’s asset quality and credit risk management. The non-performing loan to total loan ratio analysis offers valuable insights into the asset quality and credit risk management of NABIL Bank and NIC Asia Bank compared to the industry average.
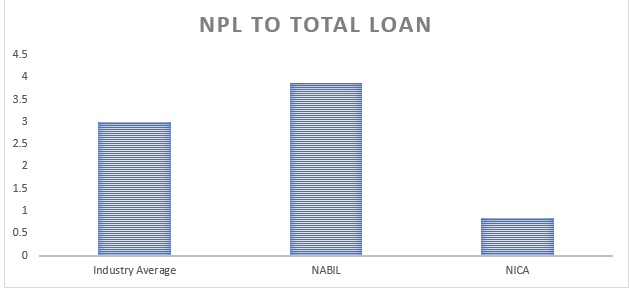
Firstly, NABIL Bank’s non-performing loan to total loan ratio of 3.87 exceeds both the industry average of 2.99 and NIC Asia Bank’s ratio of 0.85. This data suggests that NABIL Bank has more non-performing loans than its total portfolio. A higher non-performing loan ratio indicates potential credit quality challenges and higher credit risk. It implies that NABIL Bank may have greater exposure to loans that are in default or have a higher risk of default. This data necessitates close attention to the bank’s credit risk management practices and strategies to mitigate the impact of non-performing loans on its overall financial health.
In contrast, NIC Asia Bank’s non-performing loan to total loan ratio of 0.85 is considerably lower than the industry average and NABIL Bank’s ratio. This data implies that NIC Asia Bank has successfully managed its credit risk and maintained a healthier loan portfolio. A lower non-performing loan ratio indicates better asset quality and a lower risk of loan defaults. It suggests that NIC Asia Bank has implemented practical credit risk assessment, monitoring, and recovery processes, resulting in a more favourable non-performing loan ratio.
While a higher non-performing loan to total loan ratio can cause concern, it is essential to consider other factors, such as the bank’s overall loan portfolio composition, risk management practices, and industry-specific factors that may influence the non-performing loan ratio.
In conclusion, based on the provided data, NABIL Bank exhibits a higher non-performing loan to total loan ratio, indicating potential credit quality challenges and elevated credit risk. In contrast, NIC Asia Bank demonstrates a lower non-performing loan ratio, reflecting better credit risk management and healthier asset quality. Further analysis of the banks’ credit risk management strategies, loan recovery processes, and industry-specific factors would provide a more comprehensive understanding of their credit risk profiles and asset quality.
vi) Net worth per share
Net worth per share is a financial metric that measures the value of a company’s net assets on a per-share basis. Net worth per share calculated by dividing a company’s net worth or shareholders’ equity by the number of outstanding shares. The analysis of net worth per share provides insights into the value of net assets held by NABIL Bank and NIC Asia Bank compared to the industry average.
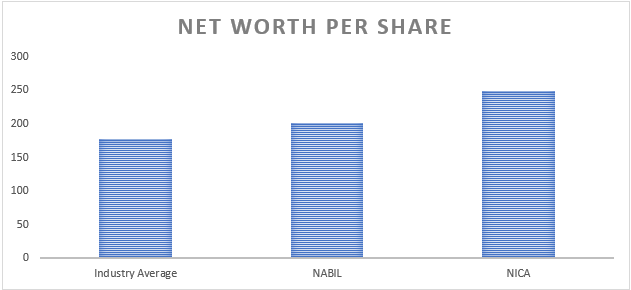
Firstly, NABIL Bank’s net worth per share of RS. 201.07 exceeds the industry average of Rs. 177.24. This data indicates that NABIL Bank has a higher net asset value per share compared to the industry average. A higher net worth per share suggests that the bank has accumulated substantial equity and retained earnings relative to the number of outstanding shares. This data reflects positively on the bank’s financial strength and stability, indicating a solid base of assets that can support future growth and withstand adverse market conditions.
Similarly, NIC Asia Bank’s net worth per share of Rs. 248.88 also surpasses the industry average. This data signifies that NIC Asia Bank has a higher value of net assets per share compared to the average benchmark. It indicates that the bank has accumulated significant equity and retained earnings, highlighting its financial robustness and capacity to generate shareholder value.
The higher net worth per share figures for NABIL Bank and NIC Asia Bank relative to the industry average demonstrate their ability to create and preserve shareholder value. These banks have effectively managed their capital structure, made profitable investments, and generated sustainable earnings over time.
Notably, net worth per share is just one aspect of a bank’s overall financial performance. Other factors such as profitability, liquidity, asset quality, and risk management practices should also be considered for a comprehensive evaluation.
In conclusion, based on the provided net worth per share data, both NABIL Bank and NIC Asia Bank exhibit higher values of net assets per share compared to the industry average. This data reflects their solid financial position, higher equity accumulation, and potential to generate shareholder value. Further analysis of their financial statements and performance indicators will provide a more comprehensive understanding of their financial health, market positioning, and ability to deliver sustainable growth and shareholder returns.
vii) PE ratio
The Price-Earnings (P/E) ratio is a financial metric that compares a company’s market price per share to its earnings per share (EPS). Price – Earnings ratio is calculated by dividing the market price per share by the EPS. The P/E ratio is valuation tool to assess the relative value of a company’s stock. Analyzing the Price-Earnings (P/E), ratio provides insights into the market’s valuation of NABIL Bank and NIC Asia Bank compared to the industry average.
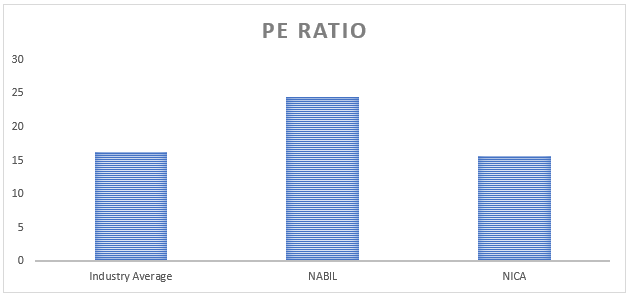
Firstly, NABIL Bank’s P/E ratio 24.55 exceeds the industry average of 16.28 and NIC Asia Bank’s ratio of 15.6. This data suggests that NABIL Bank’s stock is relatively more expensive than its earnings per share. A higher P/E ratio indicates that investors are willing to pay a premium for each unit of earnings the bank generates. It may reflect market expectations of future growth prospects, higher profitability, or other positive factors contributing to investors’ confidence in the bank.
On the other hand, NIC Asia Bank’s P/E ratio of 15.6 is lower than the industry average but similar to NABIL Bank’s ratio. This data implies that NIC Asia Bank’s stock is comparatively less expensive than its earnings per share. A lower P/E ratio may indicate that the market has priced the stock at a more modest level, potentially reflecting lower growth expectations or risk factors associated with the bank.
In conclusion, based on the provided P/E ratio data, NABIL Bank exhibits a higher valuation of its earnings per share compared to the industry average and NIC Asia Bank. This data suggests investors have a more optimistic outlook for NABIL Bank’s future earnings and growth potential.
3. Comparison of NABIL vs NICA
Based on the provided financial data, several vital metrics can shed light on their relative performance when comparing NABIL Bank and NIC Asia Bank.
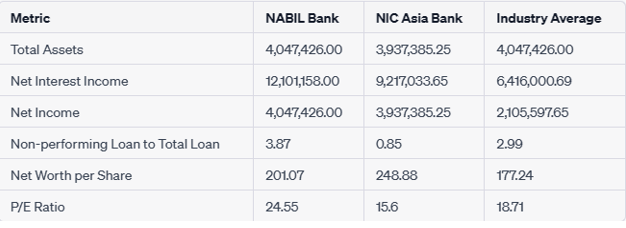
Regarding total assets, NABIL Bank has reported higher total assets of Rs. 4,047,426.00 compared to NIC Asia Bank’s total assets of Rs. 3,937,385.25. This data suggests that NABIL Bank has a more extensive asset base, indicating a higher level of business expansion and investment activities. A more extensive asset base can provide NABIL Bank with increased lending capacity and potential revenue-generating opportunities.
Moving on to net interest income, NABIL Bank has generated a net interest income of Rs. 12,101,158.00, while NIC Asia Bank has reported a net interest income of Rs. 9,217,033.65. This data indicates that NABIL Bank has a higher interest income from its lending and investment activities, implying more vital interest-earning assets or better interest rate spreads. A higher net interest income is generally considered favourable as it contributes to a bank’s profitability and ability to generate shareholder returns.
Regarding net income, NABIL Bank has reported a net income of Rs. 4,047,426.00, while NIC Asia Bank has reported a net income of Rs. 3,937,385.25. This data shows that NABIL Bank has a higher net income, indicating more robust profitability and potential for generating earnings. A higher net income reflects effective cost management, higher revenue generation, or both, which are positive indicators of the bank’s financial health and ability to create value for its stakeholders.
Analyzing the non-performing loan to total loan ratio, NABIL Bank has a ratio of 3.87, while NIC Asia Bank has a ratio of 0.85. This data suggests that NABIL Bank has a higher proportion of non-performing loans relative to its total loan portfolio compared to NIC Asia Bank. A higher non-performing loan ratio may indicate potential credit quality challenges and higher credit risk. It underscores the importance of NABIL Bank’s credit risk management practices and strategies to minimize the impact of non-performing loans on its financial performance.
Moving on to net worth per share, NABIL Bank has a net worth per share of Rs. 201.07, while NIC Asia Bank has a net worth per share of Rs. 248.88. This data indicates that NIC Asia Bank has a higher net asset value per share than NABIL Bank. A higher net worth per share reflects more robust financial stability, higher equity accumulation, and potential for generating value for shareholders.
Finally, considering the price-earnings (P/E) ratio, NABIL Bank has a ratio of 24.55, while NIC Asia Bank has a ratio of 15.6. This data suggests that NABIL Bank’s stock is relatively more expensive than its earnings per share, whereas NIC Asia Bank’s stock is priced at a more modest level. The P/E ratio reflects the market’s perception of future growth prospects and earnings potential for each bank’s stock.
In conclusion, based on the provided financial data, NABIL Bank demonstrates a more extensive asset base, higher net interest income, net income, and non-performing loan to total loan ratio compared to NIC Asia Bank. However, NIC Asia Bank exhibits a higher net worth per share and a more modest P/E ratio. It is essential to conduct a comprehensive analysis considering multiple factors to understand each bank’s financial performance, risk profile, and market valuation.