
NABIL is one of the prominent commercial banks in Nepal and is listed on the Nepal Stock Exchange. NABIL has established itself as a leading player in the banking sector in Nepal. It has a strong presence with a wide network of branches, providing a range of banking and financial services to individuals, businesses, and corporate clients. The bank offers retail banking, corporate banking, trade finance, remittance, and treasury operations.
As with any investment, it’s important to consider certain risks and factors that may influence the performance of NABIL stock. These factors include the overall economic conditions in Nepal, regulatory changes in the banking sector, and competition from other financial institutions. So, the analysis of NABIL stock based on Net Income, Earnings per Share, and Dividend per share is as follows:
Net Income
NABIL has shown consistent growth in its net income over the past years. The bank’s ability to generate increasing profits positively indicates its operational efficiency and effective management. Investors may see this as a sign of the bank’s stability and potential for future growth. However, it’s important to consider factors such as the overall economic conditions and regulatory environment that can impact the bank’s net income in the future. The line trend below shows the net income of NABIL stock.
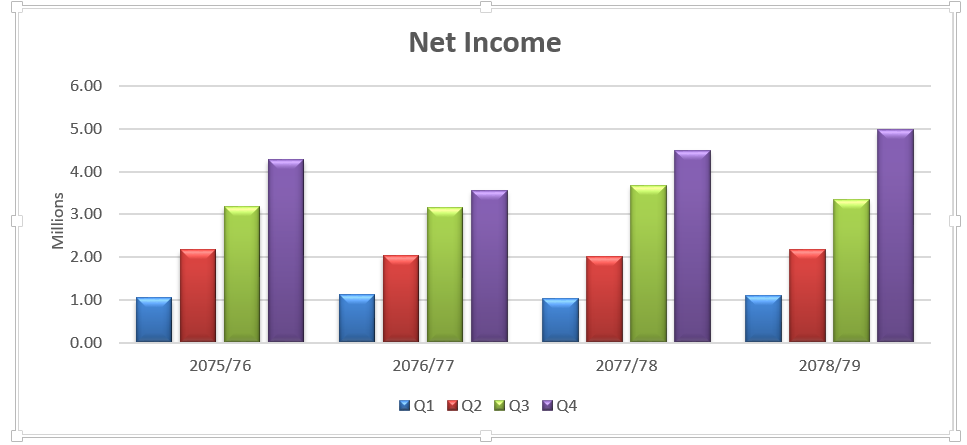
NABIL’s year-to-year net income analysis reveals a mixed performance over the four years. In 2075/76, there was consistent growth, with net income increasing from Q1 to Q4. However, in 2076/77, there was a slight decline in Q2, followed by a recovery in Q4; the fiscal year 2077/78 exhibited a mix of decline and recovery, with significant growth in Q3. In 2078/79, net income showed overall growth, except for a slight decline in Q3. These year-to-year fluctuations highlight the dynamic nature of NABIL’s net income.
Earnings per Share (EPS)
NABIL bank EPS is in decreasing trend over four year period. EPS is a significant metric as it indicates the portion of the company’s earnings allocated to each outstanding share of stock. A consistent or growing EPS is generally seen as a positive sign for investors, as it reflects the company’s profitability and potential for providing returns to shareholders and vice-versa. It’s advisable to compare NABIL’s EPS with industry peers and assess the sustainability of earnings growth to make informed investment decisions. Trend analysis of Nabil’s Stock EPS is as follows:
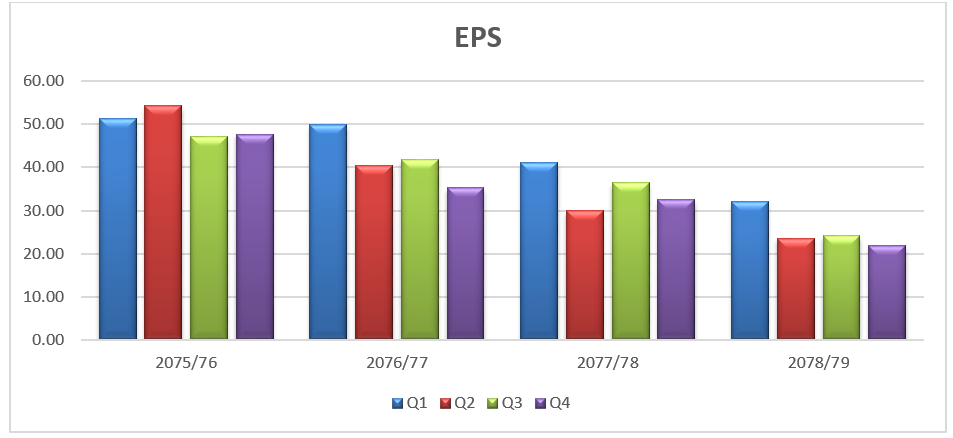
Analyzing NABIL stock’s EPS (Earnings per Share) data over the four fiscal years reveals a mixed performance. In 2075/76, the company demonstrated relatively consistent EPS figures, with Q2 recording the highest earnings per share. However, in 2076/77, there was a decline in EPS compared to the previous year, with Q4 showing the lowest earnings per share. The trend continued in 2077/78, with further decreases in EPS, although Q3 showed a slight recovery. In 2078/79, the EPS figures continued to decline, indicating a challenging year for NABIL.
Dividend per Share (DPS)
NABIL has a history of distributing dividends to its shareholders. Dividends are ways to give back to shareholders. Regular dividend payouts can be attractive to investors seeking income from their investments. It’s essential to analyze the dividend payout ratio, which measures the proportion of earnings distributed as dividends, to assess the sustainability of dividend payments. Additionally, investors should consider other factors, such as the bank’s dividend policy and the stability of its cash flows. Trend analysis of Nabil’s stock Dividend per share is presented in the chart below:
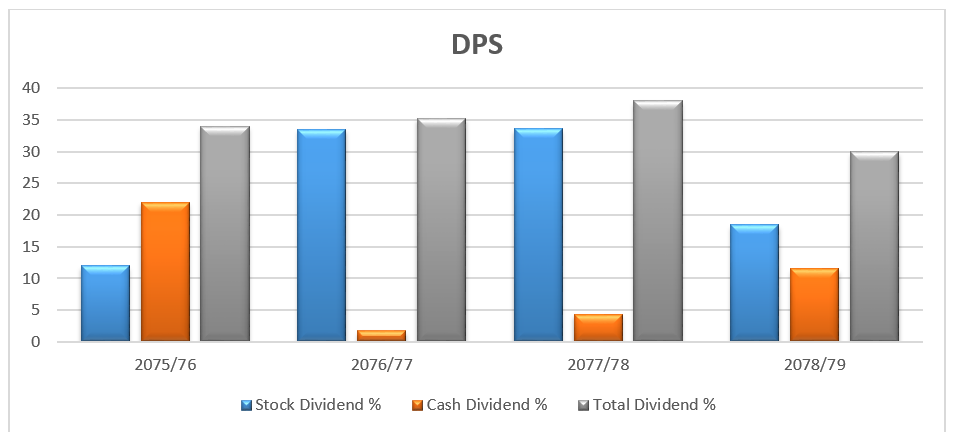
The Dividend per Share (DPS) analysis based on the provided data for NABIL stock reveals fluctuations in dividend percentages over the four fiscal years. In 2075/76, the company distributed dividends totalling 34% of the stock’s value, comprising a stock dividend of 12% and a cash dividend of 22%. The following year, 2076/77, saw a slight increase in the total dividend percentage to 35.26%, primarily driven by a higher stock dividend of 33.5%. In 2077/78, the dividend distribution increased to 38%, with a significant stock dividend of 33.6%. However, in 2078/79, the total dividend percentage decreased to 30%, mainly due to a lower stock dividend of 18.5% and a higher cash dividend of 11.5%.
Based on the provided data for NABIL Bank’s net income, EPS, and DPS over the four fiscal years, NABIL Bank’s financial performance exhibits a mixed trend over the four years. The net income shows fluctuations, with some years experiencing growth while others face declines. This data indicates that various factors, such as economic conditions, market dynamics, and internal management decisions, influence the bank’s profitability. Investors should closely examine the specific year-to-year trends to gain a deeper understanding of the bank’s performance and identify any underlying patterns or factors driving the changes in net income.
The EPS figures also show a mixed performance, with periods of growth followed by declines in certain years. This data indicates that the bank’s earnings allocated to each outstanding share have not followed a consistent trajectory. Investors need to know the number of shares they hold to accurately assess the dividend income they can expect from their investments. Moreover, analyzing the EPS trend can provide insights into the bank’s ability to generate earnings on a per-share basis and its overall profitability.
The DPS percentages for NABIL Bank demonstrate fluctuations in dividend distribution over the years, including variations in stock and cash dividends. The total dividend percentages indicate bank dividend policies and practices changes. This data suggests that the bank’s management adjusts based on financial performance, capital requirements, and shareholder expectations. Investors should carefully evaluate the bank’s dividend policies and consider the stability and consistency of dividend payments when assessing the attractiveness of investing in NABIL Bank stock.
It is important to note that financial analysis should not be solely based on individual metrics such as net income, EPS, or DPS. A comprehensive evaluation should include other financial indicators, such as return on equity, liquidity ratios, asset quality, and consideration of macroeconomic factors and industry trends. Investors should analyze the bank’s overall financial health, risk profile, growth prospects, and regulatory environment before making investment decisions.
In summary, NABIL Bank’s stock analysis based on the provided net income, EPS, and DPS data highlights the need for a holistic assessment. The stock’s performance shows a mix of growth, declines, and fluctuations, emphasizing the importance of considering multiple factors and conducting a thorough analysis before making investment decisions.